Loading…
Methodology
How raw social media posts become the harmonized, comparable measures behind this dashboard.
This page summarizes the methodology described in full in the two academic papers behind this project. See Publications for the published PartySOME I article (Jan and Sattelmayer 2025) and the forthcoming PartySOME II manuscript, and Supporting resources for the prior infrastructure (ParlGov, the Comparative Agendas Project, and others) this project builds on. It focuses on the part people most often ask about, how posts are turned into issue categories.
From raw posts to a harmonized corpus
The starting point is the PartySOME I corpus (Jan and Sattelmayer 2025), which collected official social media accounts for parties that held at least one parliamentary seat between 2005 and 2023. Account handles were manually identifieds. Posts were then collected with a mix of platform-specific tools that changed over the project's lifetime as API access policies shifted, CrowdTangle, platform APIs like the Meta Content Library. The dataset only includes organic posts from parties' own accounts. This means that on Twitter for example, retweets are not part of this dataset. Over time, we extended the corpus to new platforms such as Bluesky and Telegram and the data collection for TikTok is still ongoing. The initial PartySOME I corpus only included posts up until the end of 2024. This website includes an extension and update of the corpus to include posts until August 2026.
Classifying posts into issues
A large literature in political science focuses on the issues that parties devote attention to, and how that attention shifts over time. This literature has produced a standard framework for measuring issue salience, which our project applies to social media posts. We measure issue salience using the coding scheme of the Comparative Agendas Project (CAP) (Baumgartner, Breunig, and Grossman 2019). It is a standardized framework for comparing issue attention across countries and sources.
Traditionally, this coding scheme was used for manifestos, parliamentary speeches, or bills. Applying it to social media is not a straightforward extension as a large share of party posts (campaign announcements, event flyers, personal content) are not about policy at all, and off-the-shelf CAP classifiers tend to force a policy label onto them anyway.
Our classification pipeline therefore runs in two steps to handle the intricacies of social media text data and classify posts into CAP issue categories.
- Policy / non-policy filter. We fine-tuned a multilingual deBERTa model on more than 19,000 hand-coded posts (stratified by country and platform, double-coded for reliability, Krippendorff's α = 0.90) . This model detects and separates policy-relevant posts from everything else. It reached an F1 score of 0.90. Posts classified as non-policy are excluded from issue classification and instead counted under “No Policy Content.”
- Issue classification. Posts that pass the filter are classified into CAP issue categories using the multilingual RoBERTa model developed by PolTextLab (Sebők et al. 2025), trained on a large, diverse corpus of political texts.
Posts in languages the team does not speak were machine-translated into English before annotation, using open-source models from Meta and Facebook Research (Fan et al. 2021; see also Licht and Lind 2023). The CAP-model issue-classified each post individually. When a party published no policy-related post in a given month, its salience for every issue was set to zero.
Why this two-step design, and not something simpler
As discussed above, a large share of party social media posts are not about policy at all. We identified this as a problem for off-the-shelf CAP classifiers, which tend to force a policy label onto every post. Furthermore, they had been trained on manifestos, parliamentary speeches, and bills, which are very different from social media posts in style and content.
We identified four possible configurations for the classification pipeline, and benchmarked them against a hand-coded sample of 5,362 posts (Krippendorff's α = 0.86 on a 200-post reliability subsample) . All four configurations used the same PolTextLab classifier for the second step, but differed in whether they used the policy/non-policy filter first, and whether they used the off-the-shelf PolTextLab model or a fine-tuned version of it.
The four configurations are shown in the table below, along with their performance on the hand-coded sample. We report macro precision, recall, and F1 (rather than accuracy) to fairly weigh all 21 issue categories despite their very unequal frequencies. Our results show that the policy filter improves the off-the-shelf model the most (macro F1 rises from 0.67 to 0.75). At the same time, an additional fine-tuning of the classifier does not improve performance. Hence, the policy filter plus off-the-shelf combination performs best overall and is what we used for our analysis.
| Configuration | Accuracy | Precision | Recall | F1 |
|---|---|---|---|---|
| Off-the-shelf PolTextLab | 0.56 | 0.65 | 0.82 | 0.67 |
| Fine-tuned PolTextLab | 0.82 | 0.71 | 0.72 | 0.71 |
| Policy filter + off-the-shelf PolTextLab | 0.81 | 0.73 | 0.80 | 0.75 |
| Policy filter + fine-tuned PolTextLab | 0.83 | 0.72 | 0.70 | 0.70 |
Macro-averaged metrics across 21 CAP issue categories. Adding the policy filter improves the off-the-shelf model the most (macro F1 rises from 0.67 to 0.75). Once the classifier itself is fine-tuned, the filter adds little on top. The policy filter plus off-the-shelf combination performs best overall and is what we used for our analysis.
What counts as a policy post
The 19,000-post training sample for the policy/non-policy filter was hand-coded against a fixed set of criteria (Krippendorff's α = 0.90 on a double-coded subsample) . We developed the codebook below for the annotation process to determine what distinguishes a policy post from a non-policy one.
CAP categories used here
This project classifies posts into 21 CAP major-topic categories (plus “No Policy Content,” this project's own label for posts the first-step filter excludes, not a CAP topic itself). These are a subset of the full CAP scheme, which also defines hundreds of more granular sub-topics within each category – the full list of categories and their sub-topics is in the table further down this section.
A note on Government Operations. This category is the weakest-performing label the classifier produces, and it is also the least conceptually stable one across countries. As we explain in the PartySOME II paper, we do not see this as a modeling failure but as a relict from how the CAP codebook itself came together. The Comparative Agendas Project began as a set of national research teams that each built their own country-specific coding scheme independently, and these were harmonized into a single master codebook only later (Bevan 2019). Government administration and territorial politics were among the topics coded quite differently across those original national schemes (as these issues are vastly different across countries). Since the BERT model we used was trained on the nationally slightly different CAP annotations, its inconsistencies carry over into the classification process. In practice, this shows up as content that one country's scheme would code as Government Operations (discussions of devolution and regional autonomy in Spain, for instance) being captured under Public Lands or another category elsewhere. We discuss and recommend in the paper that the category of Government Operations ought to be treated with caution in any downstream analysis, and we exclude it from the descriptive comparisons further down this page for the same reason.
The subtopic names below are taken from the Comparative Agendas Project's own master codebook and belong to the CAP research community (Baumgartner, Breunig, and Grossman 2019; Bevan 2019). The live master codebook is the authoritative and most current version.
| Category | Subtopics |
|---|---|
| Macroeconomics | General, Interest Rates, Unemployment Rate, Monetary Policy, National Budget, Tax Code, Industrial Policy, Price Control, Other |
| Civil Rights | General, Minority Discrimination, Gender Discrimination, Age Discrimination, Handicap Discrimination, Voting Rights, Freedom of Speech, Right to Privacy, Anti-Government, Other |
| Health | General, Health Care Reform, Insurance, Drug Industry, Medical Facilities, Insurance Providers, Medical Liability, Manpower, Disease Prevention, Infants and Children, Mental Health, Long-term Care, Drug Coverage and Cost, Tobacco Abuse, Drug and Alcohol Abuse, Research and Development, Other |
| Agriculture | General, Trade, Subsidies to Farmers, Food Inspection and Safety, Food Marketing and Promotion, Animal and Crop Disease, Fisheries and Fishing, Research and Development, Other |
For the authoritative definitions, sub-topics, and coding rules behind each category, see the Comparative Agendas Project's own master codebook.
Patterns consistent with issue ownership
In our paper we report several validity checks of the data. What follows below are descriptive checks, not a formal statistical test. It asks a simple question. Do party families pay attention to the issues that decades of research on issue ownership already lead us to expect (Petrocik 1996; Walgrave, Lefevere, and Tresch 2012)? As could be expected, the radical right party family shows the highest attention to Immigration and Law and Crime of any other party family. Green parties show, by a wide margin, the highest attention to the Environment. Social democratic and radical left parties show elevated attention to Macroeconomics, Civil Rights, and Labor relative to other families (Government Operations is left out of this comparison for the reasons explained above).
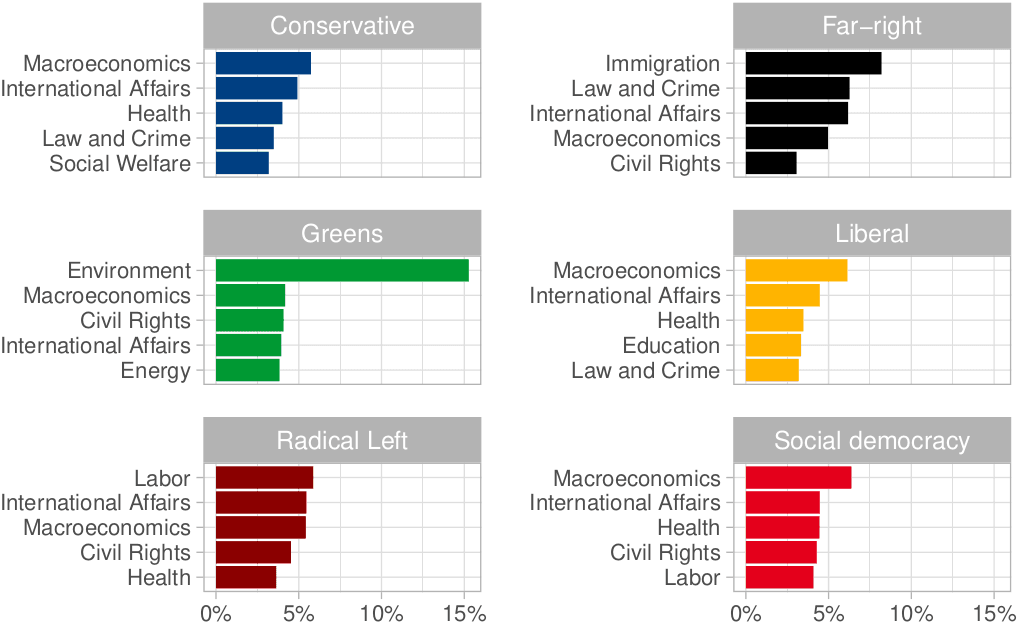
This one stays a static image for now: party ideological family isn't currently populated in the live dataset for any party (the field exists, but is null everywhere), so there's no live data to group by yet. The two charts below it are live.
Patterns around major events
A second descriptive check looks at whether issue attention moves the way we would expect around major events that had nothing to do with this dataset or its collection. Two illustrative cases are considered here. The first is Russia's invasion of Ukraine in February 2022, after which attention to Energy, Defense, and International Affairs would plausibly rise. The second is the onset of the COVID-19 pandemic in early 2020, after which attention to Health would plausibly rise sharply, alongside a drop in the share of posts with no policy content at all, as parties shifted from routine campaign material toward pandemic-related communication.
These two are now live, pulled straight from the dataset behind this dashboard rather than a fixed export – they'll keep reflecting the corpus as it grows. One simplification versus the paper: the paper's smoothed line is fit over the full party-month panel (one point per party per month), while this version fits over each month's across-party average. Same story, slightly different input to the smoother.
Early data and reliability
Coverage is not uniform over time. In the corpus's early years, roughly the mid-to-late 2000s through the early 2010s, relatively few parties had adopted social media at all, the platforms themselves were still growing their user bases, and the parties that were present hadn't yet developed the professionalized, planned posting strategies that came later. Practically, this means some party-platform-months in that period rest on a small handful of posts.
That matters specifically for the analysis issue attention/shares. A share of posts, i.e. the monthly attention a party devotes to a specific issue, is a ratio, and a ratio computed from a small denominator is noisy. One post about, say, Foreign Trade out of three total posts that month reads as a 33% share, not because the party suddenly prioritized trade policy, but because there were only three posts to begin with. Raw counts don't have this problem the same way, but any chart on this site expressed as a percentage can be distorted by exactly this pattern in thin periods.
Two things follow from this regarding the live dashboard. First, every date-range control defaults to 2012 onward rather than the full corpus, on the reasoning that this is where posting activity becomes broadly representative across the tracked parties. The full range, including the thinner early years, is always one click away (the “All time” option). Second, every chart that plots a share over time has a reliability control. “Hide below min. N” simply removes any period whose post count falls under a threshold you set (10 by default) rather than plotting a share computed from too few posts, and the Issues page additionally offers “shrink toward baseline,” which pulls thin periods toward that series' own share over the whole selected window instead of dropping them outright. Neither setting changes the underlying data. Both are purely display-side ways to avoid mistaking noise for signal.
What is and isn't released
To comply with platforms' terms of service, raw post text and individual post-level classifications are not published. The public release consists of aggregated monthly party-issue salience measures, together with the hand-annotated training and validation data used to build and evaluate the classifiers, so the pipeline itself can be audited, replicated, or improved on.
Full details, including the CAP codebook, the complete party list, and the exact model configurations, are in the Supplementary Material of the forthcoming PartySOME II paper (see Publications), and the data itself is on GitHub.
Bibliography
Baumgartner, F. R., Breunig, C., & Grossman, E. (Eds.). (2019). Comparative Policy Agendas: Theory, Tools, Data. Oxford University Press.
Bevan, S. (2019). Gone fishing, the creation of the Comparative Agendas Project master codebook. In F. R. Baumgartner, C. Breunig, & E. Grossman (Eds.), Comparative Policy Agendas: Theory, Tools, Data (pp. 17 to 34). Oxford University Press.
Fan, A., Bhosale, S., Schwenk, H., Ma, Z., El-Kishky, A., Goyal, S., Baines, M., et al. (2021). Beyond English-centric multilingual machine translation. Journal of Machine Learning Research, 22(107), 1 to 48.
Jan, M., & Sattelmayer, L. (2025). PartySOME, a comprehensive dataset on political parties' social media activity. Party Politics. See Publications for the full citation and BibTeX.
Licht, H., & Lind, F. (2023). Going cross-lingual, a guide to multilingual text analysis. Computational Communication Research, 5(2), 1.
Petrocik, J. R. (1996). Issue ownership in presidential elections, with a 1980 case study. American Journal of Political Science, 825 to 850.
Sebők, M., Máté, Á., Ring, O., Kovács, V., & Lehoczki, R. (2025). Leveraging open large language models for multilingual policy topic classification, the Babel Machine approach. Social Science Computer Review, 43(2), 295 to 317.
Walgrave, S., Lefevere, J., & Tresch, A. (2012). The associative dimension of issue ownership. Public Opinion Quarterly, 76(4), 771 to 782.